Tool Explorer
Tool Explorer is a submodule that adds an admin UI for browsing and executing the tools registered on your site. It is useful for confirming that a tool is discovered, reading its inputs and outputs, checking its config schema, and running it by hand.
Enable it with:
drush en tool_explorer
Access requires the administer tool permission. The UI lives at
Configuration > Development > Tool Explorer
(/admin/config/tool/explorer).
Tool list
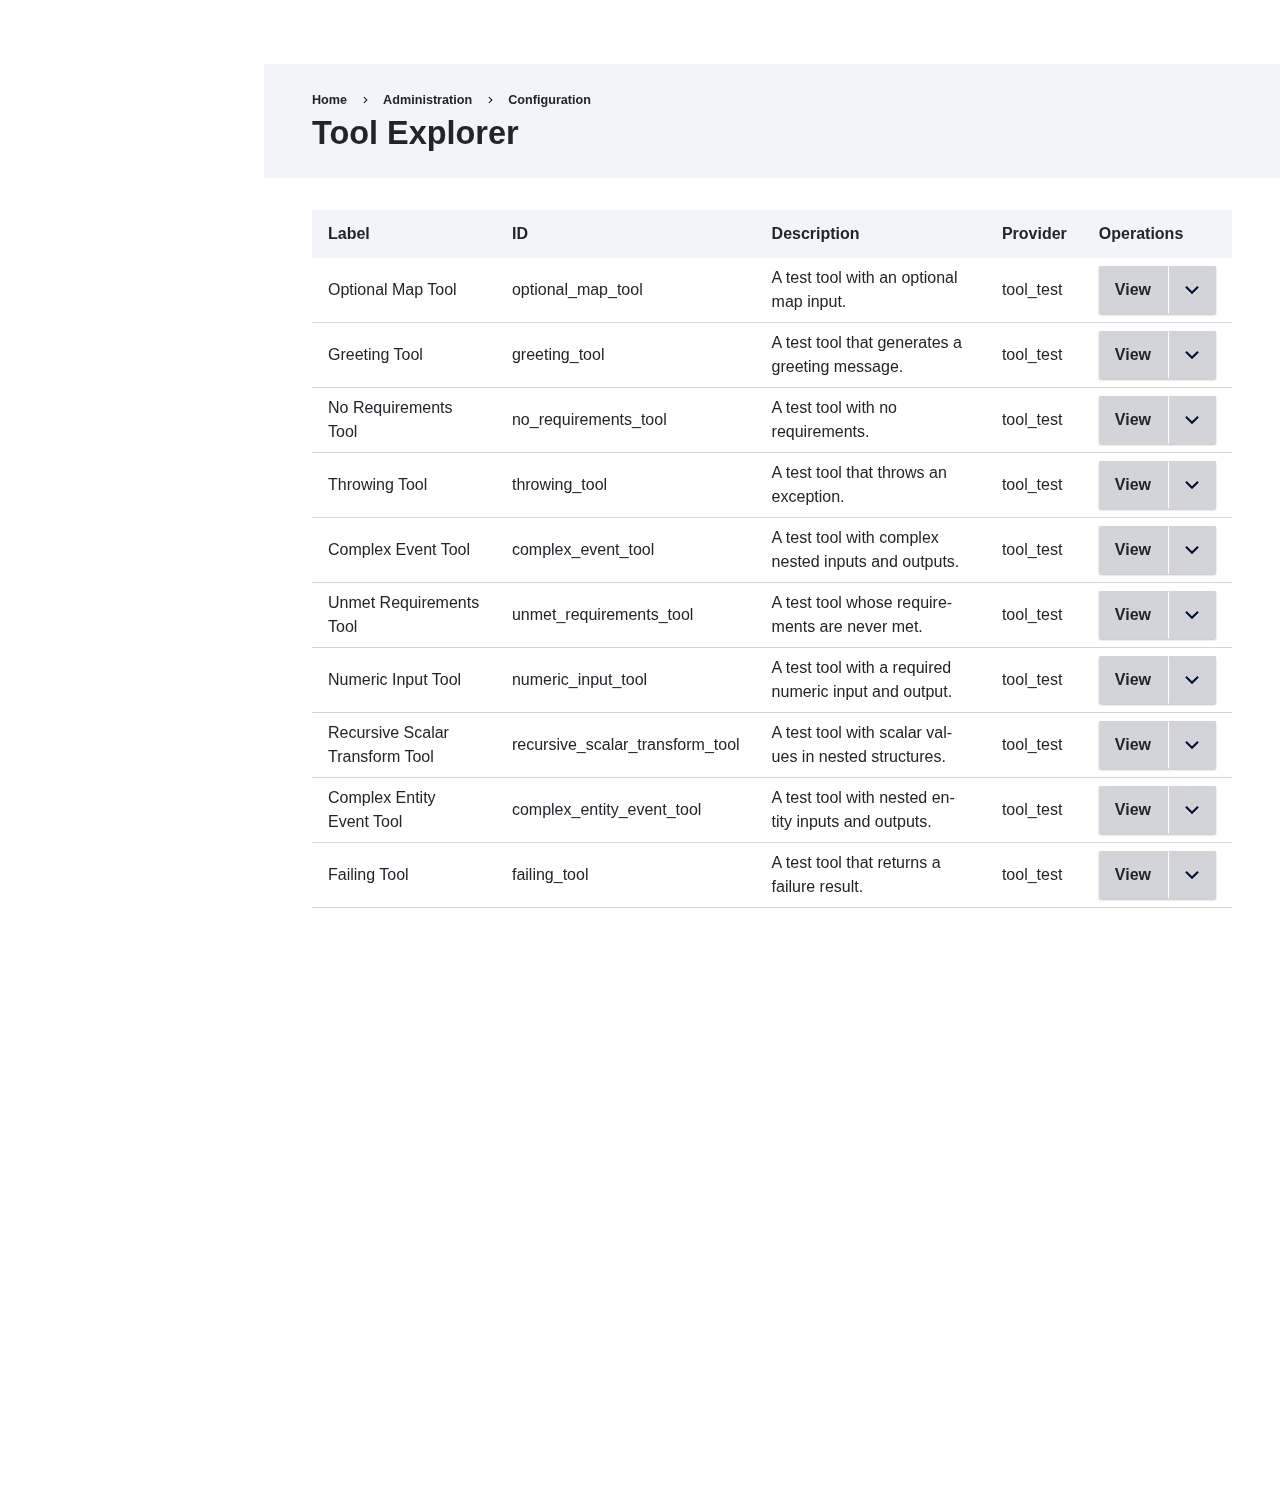
The landing page lists every registered tool with its label, plugin ID, description, and the module that provides it. Each row has View and Execute operations.
Tool details
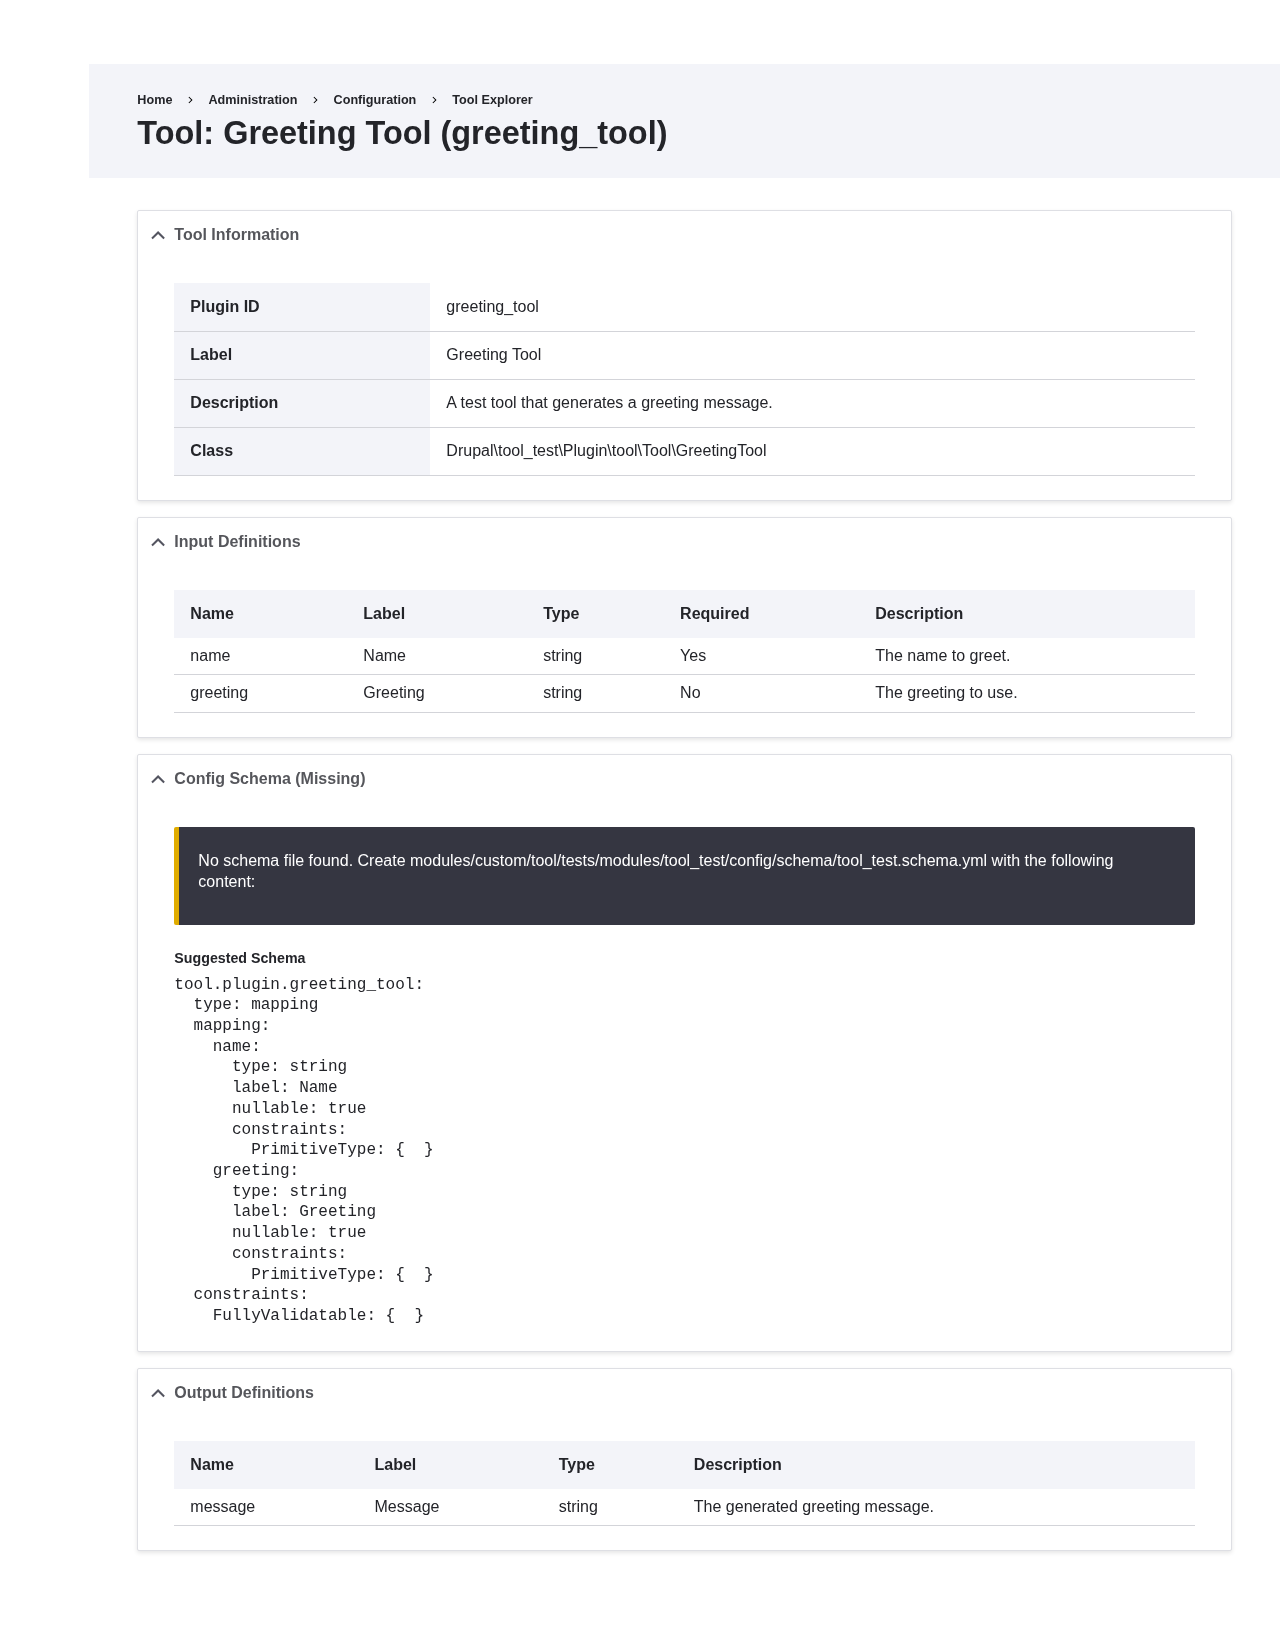
The View page shows the full definition of a single tool:
- Tool Information: plugin ID, label, description, and implementing class.
- Input Definitions: each input's name, label, data type, whether it is required, and its description.
- Output Definitions: each output's name, label, data type, and description.
- Config Schema: whether a
tool.plugin.<id>config schema exists for the tool. When it is missing, the page prints a suggested schema you can paste into the provider module'sconfig/schemafile.
Executing a tool
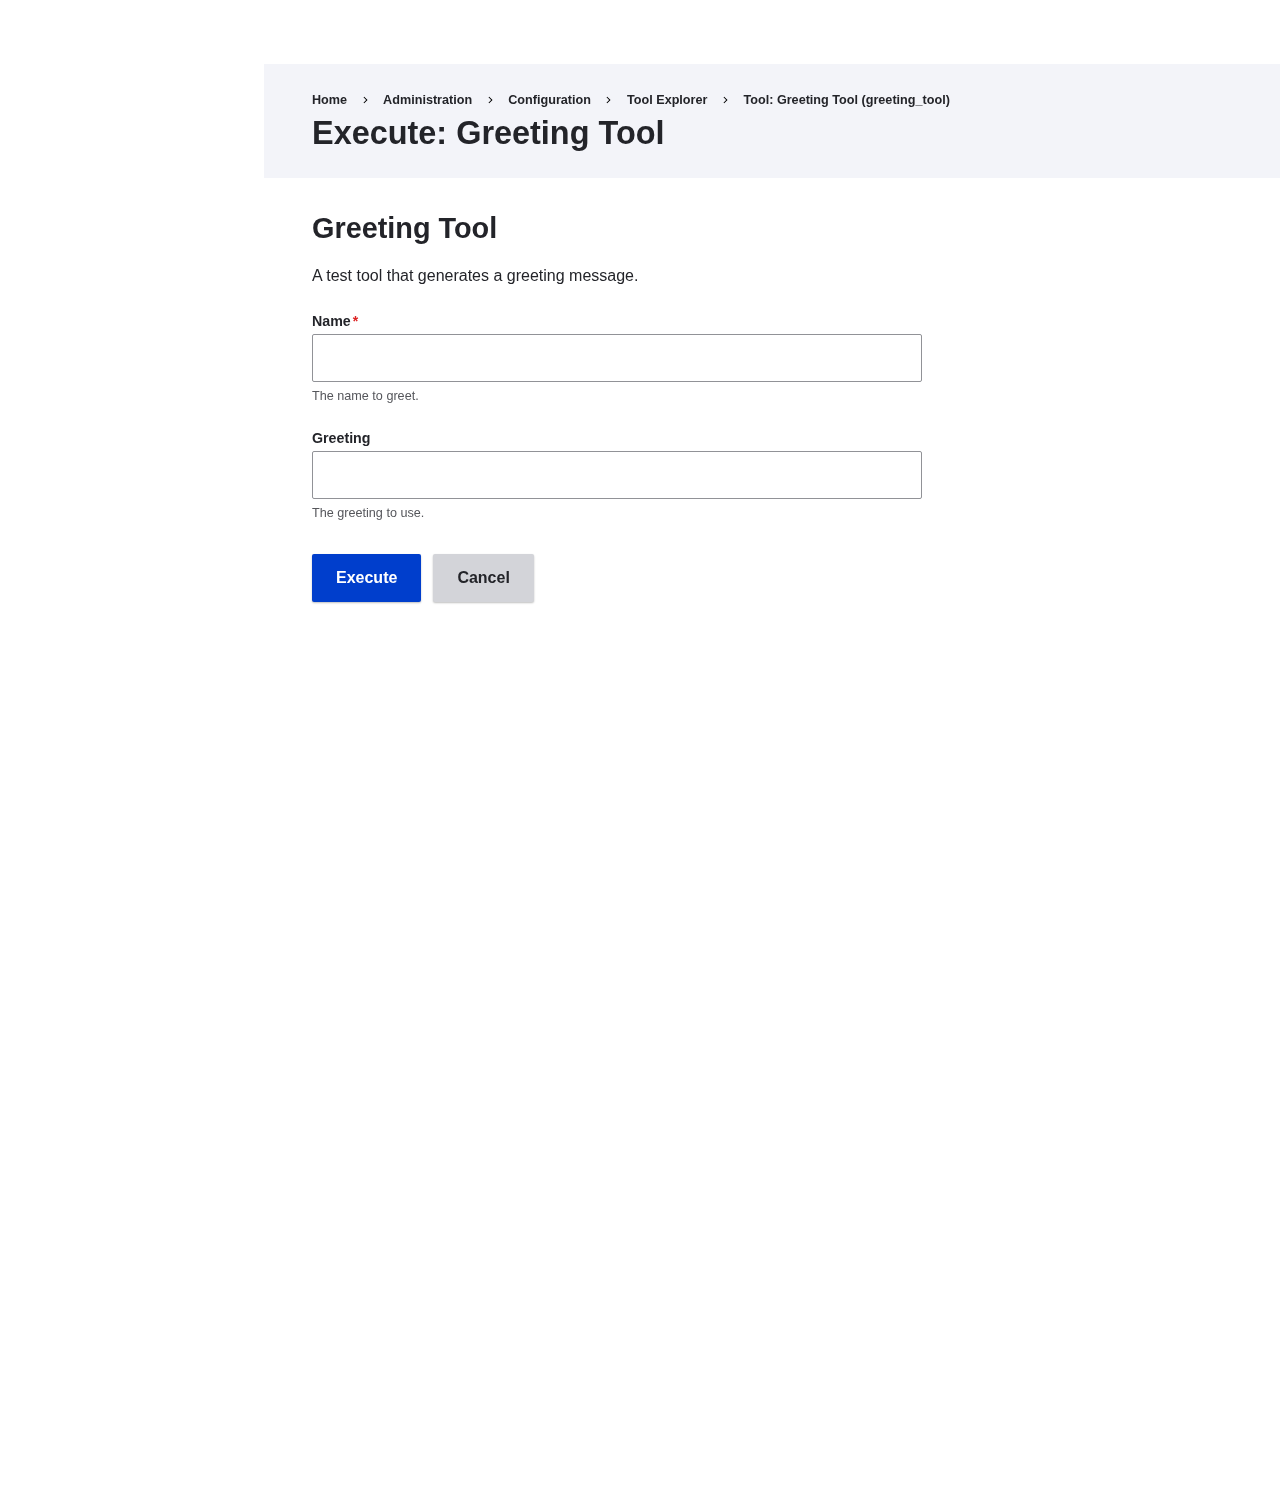
The Execute page renders a form built from the tool's input definitions, with required fields marked and descriptions shown as help text. Submit the form to run the tool as the current user.
Note
The Execute form reports whether execution succeeded or failed, but it does not
print output values. Output can contain data the current user is not allowed to
see (for example, fields on an entity they can view only partially), so the UI
withholds it. Use drush tool:run when you need to inspect returned
values.